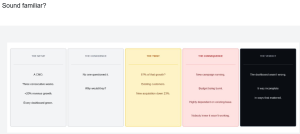
You need to always ask WHY
The data reported positive news. The company reacted by increasing marketing budget. Sales tanked as the data was incomplete. Who was at fault? I say the CMO for not asking WHY.
Blog
The data reported positive news. The company reacted by increasing marketing budget. Sales tanked as the data was incomplete. Who was at fault? I say the CMO for not asking WHY.
It is easy to recognise there is a gap between the investment Digital Analytics and the impact on business performance from it. But what is the cause, is it the technology letting us down or is the people?
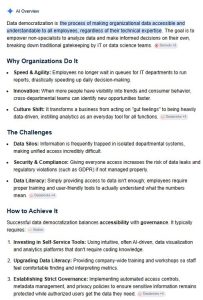
What if Data Democracy is not enough? The technology has now advanced sufficiently to achieve this but we are still missing the business impact. Do we need to get better at asking good questions, not just having the answers?
Reviewing my talks going back to 2008, I have been talking about the barriers to maximising the impact from Digital Analytics for a long time. Frustratingly, these barriers appear to have remained broadly the same, despite all the change in that time.
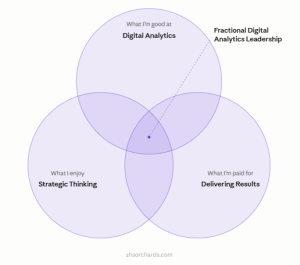
People, including myself, have asked why I am back working for myself and why as a Fractional Digital Analytics Leader, why not a new client side role or starting my own agency or basically anything else. Simple answer is I picked out the best bits of different options, put it all together and this fractional approach is my way to describe it.

This post was written by Samantha Silye while she was working under the ZHS Orchards brand. That is no longer the case but the post has been retained here for…

This post was written by Samantha Silye while she was working under the ZHS Orchards brand. That is no longer the case but the post has been retained here for…

This post was written by Samantha Silye while she was working under the ZHS Orchards brand. That is no longer the case but the post has been retained here for…

This post was written by Samantha Silye while she was working under the ZHS Orchards brand. That is no longer the case but the post has been retained here for…

This post was written by Samantha Silye while she was working under the ZHS Orchards brand. That is no longer the case but the post has been retained here for…